![]()

![]()
Copernicus Marine
Service Information is a programme subsidised by the European
Commission. Its mission is to provide free authoritative information on
the oceans physical and biogeochemical state. The
CopernicusMarine R package is developed apart from this
programme and facilitates retrieval of information from https://data.marine.copernicus.eu. With the package you
can:
CopernicusMarineCopernicus Marine offers access to their data services through a Python application
interface. For R users this requires complex installation procedures
and is difficult to maintain in a stable R package. The
CopernicusMarine R package has a much simpler installation
procedure (see below) and does not depend on third party software, other
than packages available from CRAN.
Install CRAN release:
install.packages("CopernicusMarine")Install latest developmental version from R-Universe:
install.packages("CopernicusMarine", repos = c('https://pepijn-devries.r-universe.dev', 'https://cloud.r-project.org'))The package provides an interface between R and the Copernicus Marine services. Note that for some of these services you need an account and have to comply with specific terms. The usage section briefly shows three different ways of obtaining data from Copernicus:
Please check the manual for complete documentation of the package.
The example below demonstrates how to subset a specific layer for a
specific product. The subset is constrained by the region,
timerange and verticalrange arguments. The
subset is downloaded to memory represented as a stars
object.
my_data <-
  cms_download_subset(
    product       = "GLOBAL_ANALYSISFORECAST_PHY_001_024",
    layer         = "cmems_mod_glo_phy-cur_anfc_0.083deg_P1D-m",
    variable      = c("uo", "vo"),
    region        = c(-1, 50, 10, 55),
    timerange     = c("2025-01-01", "2025-01-02"),
    verticalrange = c(0, -2),
    progress      = FALSE
)

plot(my_data["vo"], col = hcl.colors(100), axes = TRUE)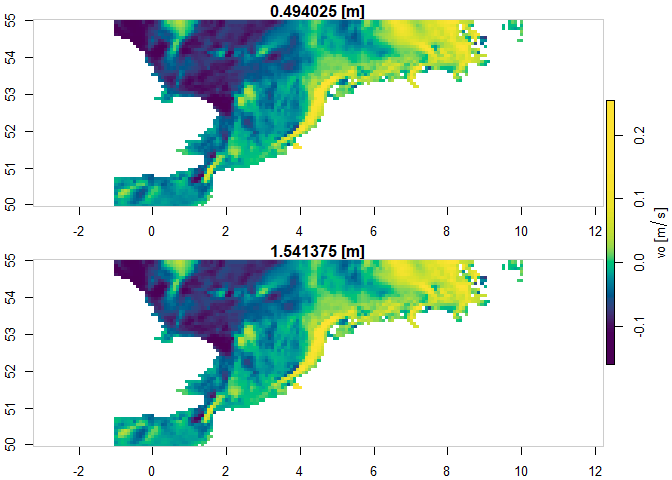
If you don’t want to subset the data and want the complete set, you
can download complete native files, if these are available for your
product. You can list available files with (restricted to first 10
results with max=10):
native_files <-
  cms_list_native_files(
    "GLOBAL_ANALYSISFORECAST_PHY_001_024",
    "cmems_mod_glo_phy-cur_anfc_0.083deg_P1D-m",
    max = 10)
native_files
#> # A tibble: 10 × 9
#>    Key   LastModified ETag  Size  Owner_ID Owner_DisplayName StorageClass Bucket
#>    <chr> <chr>        <chr> <chr> <chr>    <chr>             <chr>        <chr>
#>  1 nati… 2024-04-18T… "\"4… 1939… b8c2197… cloud_38953_ext_… STANDARD     mdl-n…
#>  2 nati… 2024-04-18T… "\"9… 1939… b8c2197… cloud_38953_ext_… STANDARD     mdl-n…
#>  3 nati… 2024-04-18T… "\"9… 1939… b8c2197… cloud_38953_ext_… STANDARD     mdl-n…
#>  4 nati… 2024-04-18T… "\"c… 1939… b8c2197… cloud_38953_ext_… STANDARD     mdl-n…
#>  5 nati… 2024-04-18T… "\"2… 1938… b8c2197… cloud_38953_ext_… STANDARD     mdl-n…
#>  6 nati… 2024-04-18T… "\"0… 1938… b8c2197… cloud_38953_ext_… STANDARD     mdl-n…
#>  7 nati… 2024-04-18T… "\"5… 1939… b8c2197… cloud_38953_ext_… STANDARD     mdl-n…
#>  8 nati… 2024-04-18T… "\"5… 1939… b8c2197… cloud_38953_ext_… STANDARD     mdl-n…
#>  9 nati… 2024-04-18T… "\"9… 1939… b8c2197… cloud_38953_ext_… STANDARD     mdl-n…
#> 10 nati… 2024-04-18T… "\"1… 1939… b8c2197… cloud_38953_ext_… STANDARD     mdl-n…
#> # ℹ 1 more variable: base_url <chr>
Downloading a specific (or multiple file) can be done with:
cms_download_native(
  destination   = tempdir(),
  product       = "GLOBAL_ANALYSISFORECAST_PHY_001_024",
  layer         = "cmems_mod_glo_phy_anfc_0.083deg_PT1H-m",
  prefix        = "2022/06/",
  pattern       = "m_20220630"
)
The file, whose file name matches the pattern, will be stored in the specified destination folder. By default the progress is printed as files can be very large and may take some time to download.
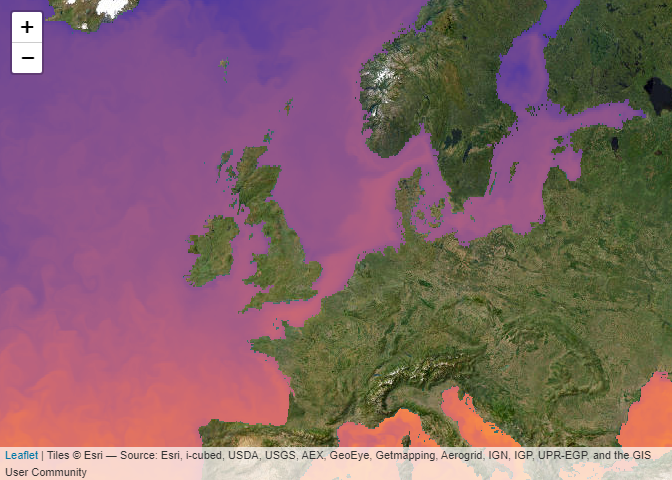
Web Map Tile Services (WMTS) allow to quickly plot pre-rendered images onto a map. This may not be useful when you need the data for analyses but is handy for quick visualisations, inspection or presentation of data. In R it is very easy to add WMTS layers to an interactive map using leaflet. This page is rendered statically and resulting in a non-interactive map.
leaflet::leaflet() |>
  leaflet::setView(lng = 3, lat = 54, zoom = 4) |>
  leaflet::addProviderTiles("Esri.WorldImagery") |>
  addCmsWMTSTiles(
    product     = "GLOBAL_ANALYSISFORECAST_PHY_001_024",
    layer       = "cmems_mod_glo_phy-thetao_anfc_0.083deg_P1D-m",
    variable    = "thetao"
  )
A Copernicus account comes with several terms of use. One of these is that you properly cite the data you use in publications. In fact, we also have credit the data used in this documentation, which can be easily done with the following code:
cms_cite_product("GLOBAL_ANALYSISFORECAST_PHY_001_024")$doi
#> [1] "E.U. Copernicus Marine Service Information; Global Ocean Physics Analysis and Forecast - GLOBAL_ANALYSISFORECAST_PHY_001_024 (2016-10-14). DOI:10.48670/moi-00016"Please note that the CopernicusMarine project is released with a Contributor Code of Conduct. By contributing to this project, you agree to abide by its terms.