![]()
![]()
![]()
The goal of the isoorbi R package is to help you process isotopocule
measurements from an Orbitrap Isotope Solutions mass
spectrometer. It can read both the .raw files (recommended
approach) as well as .isox output created by IsoX (legacy
approach).
You can install the current CRAN version of isoorbi
with:
install.packages("isoorbi")To use the latest updates, you can install the development version of
isoorbi from GitHub. If
you are on Windows, make sure to install the equivalent version of Rtools for
your version of R (you can find out which version you have with
getRversion() from an R console - note that isoorbi
requires R version 4.4 or
newer).
# checks that you are set up to build R packages from source
if(!requireNamespace("pkgbuild", quietly = TRUE)) install.packages("pkgbuild")
pkgbuild::check_build_tools()

# installs the latest isoorbi package from GitHub
if(!requireNamespace("pak", quietly = TRUE)) install.packages("pak")
pak::pak("isoverse/isoorbi")
Important: as of isoorbi version 1.5.0, it is possible to read .raw files directly using the isoraw reader built into this package. The first time you read a .raw file, you will be asked to agree to Thermo’s license agreement to proceed. Implementation of the isoraw reader, would not have been possible without the example provided by Jim Shofstahl as part of Thermo’s RawFileReader and the raw file reader developed by Witold Wolski, Christian Panse, Christian Trachsel, and Tobias Kockmann as part of the rawrr package.
# load library
library(isoorbi)

# provide the path to your data folder here:
my_data_folder <- file.path("project", "data")

# and search for raw files in that folder
file_paths <- orbi_find_raw(my_data_folder)

# for this example, we use a small raw test file bundled with the
# package instead (remove this line if working with your own data)
file_paths <- orbi_get_example_files("nitrate_test_10scans.raw")

# read the raw file incluing 2 of the raw spectra
raw_files <- file_paths |>
    orbi_read_raw(include_spectra = c(1, 10)) |>
    orbi_aggregate_raw()

# plot the spectra
raw_files |> orbi_plot_spectra()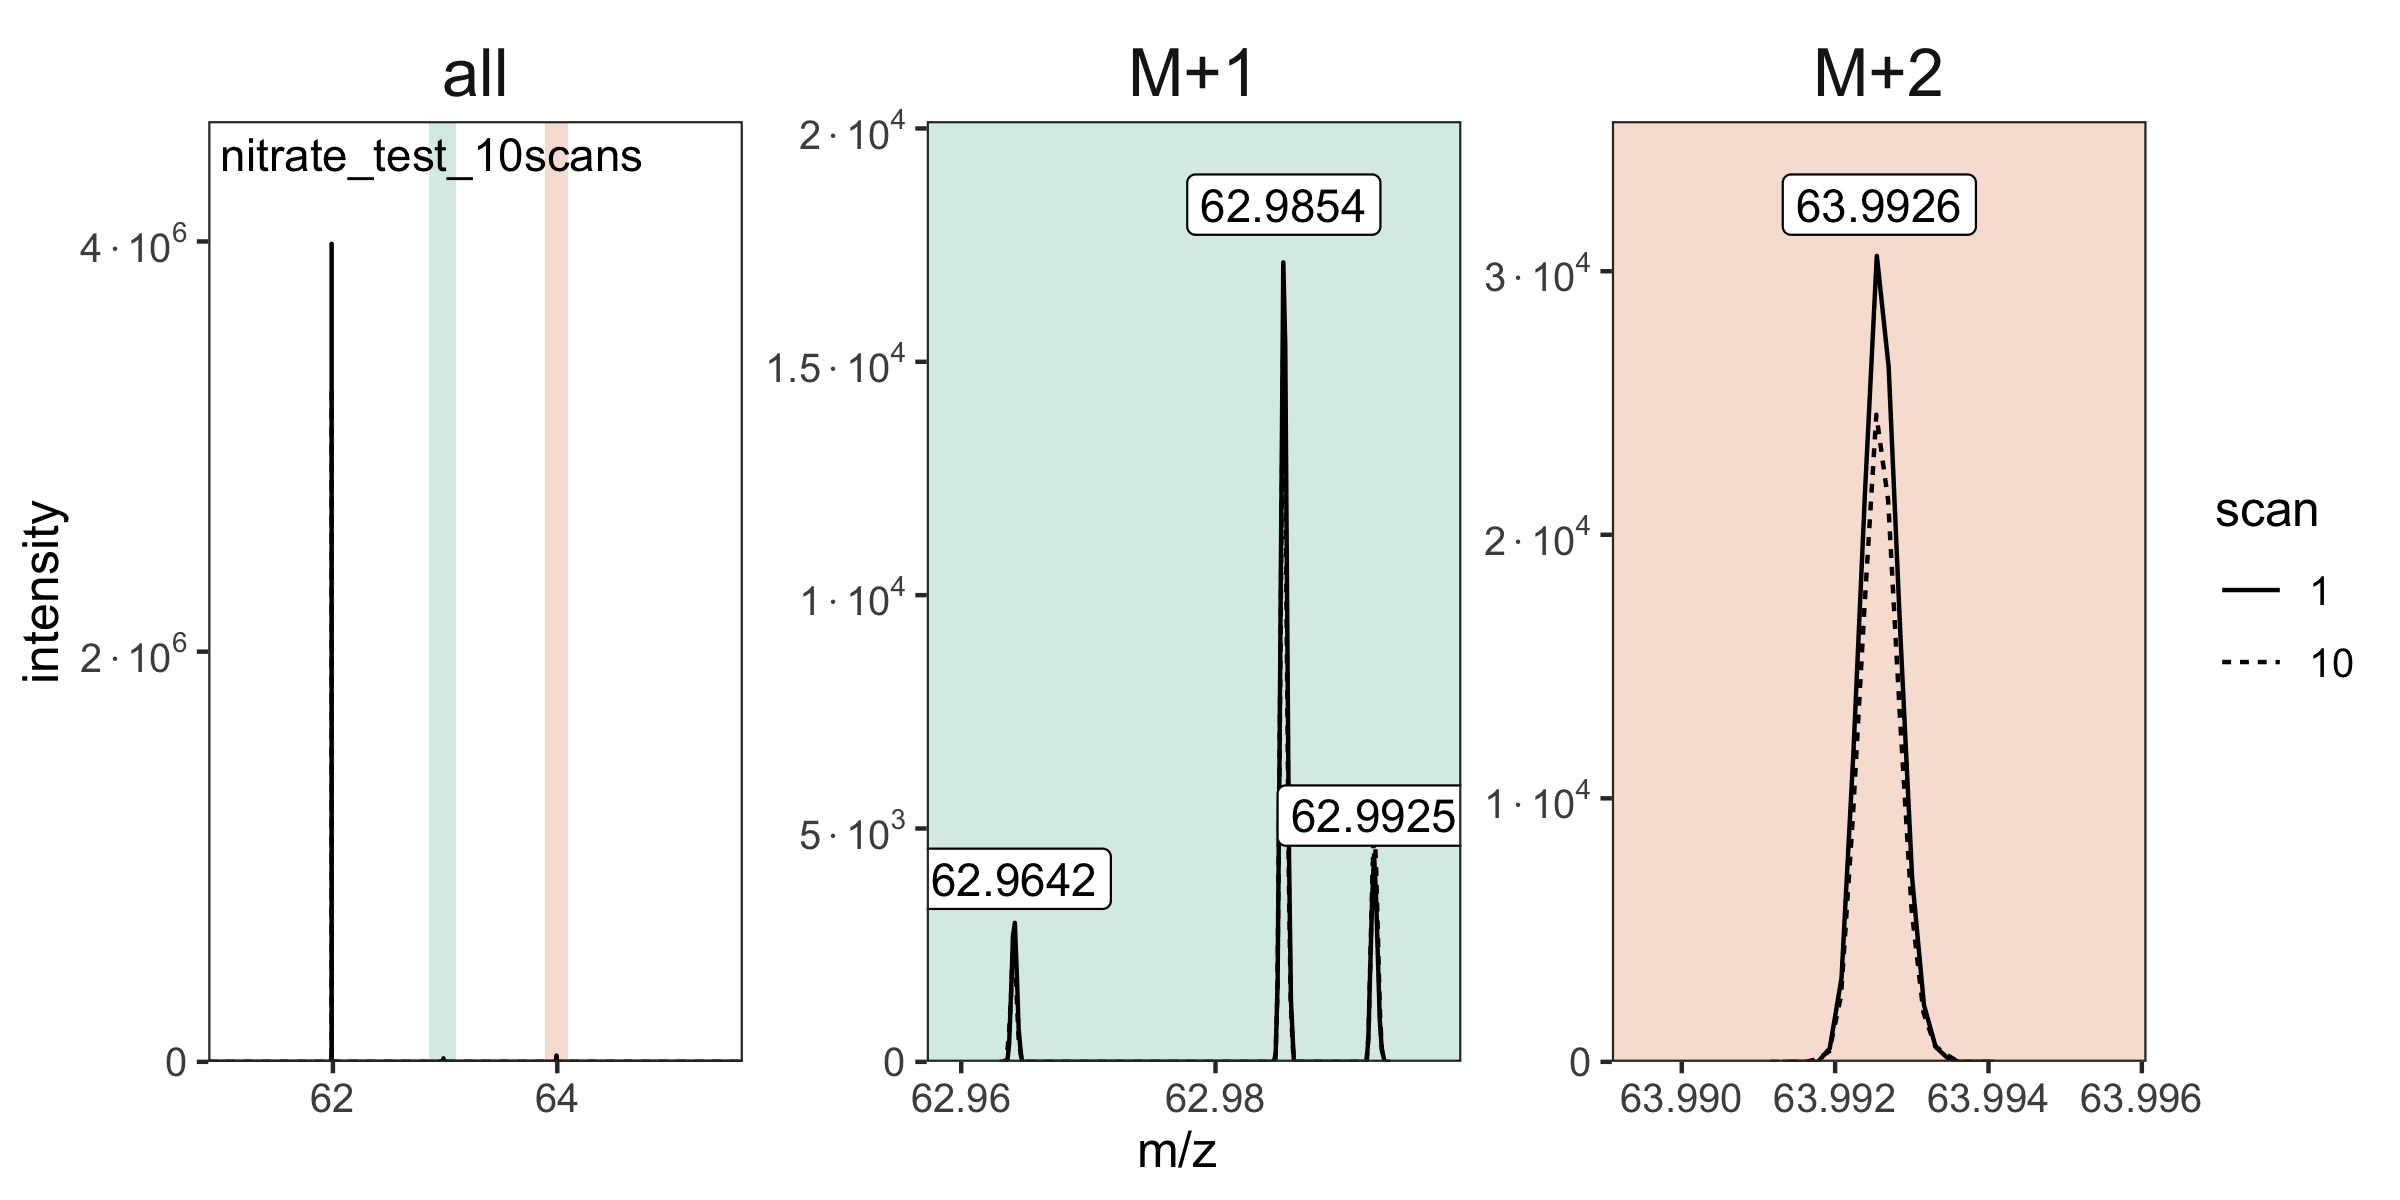
# identify isotopcules
# these could also come from a data frame or a tsv/csv/excel file
raw_files <- raw_files |> orbi_identify_isotopocules(
  isotopocules =
    c("M0" = 61.9878, "15N" = 62.9850, "17O" = 62.9922, "18O" = 63.9922)
)

# plot again, now with the isotopocules identified
raw_files |> orbi_plot_spectra()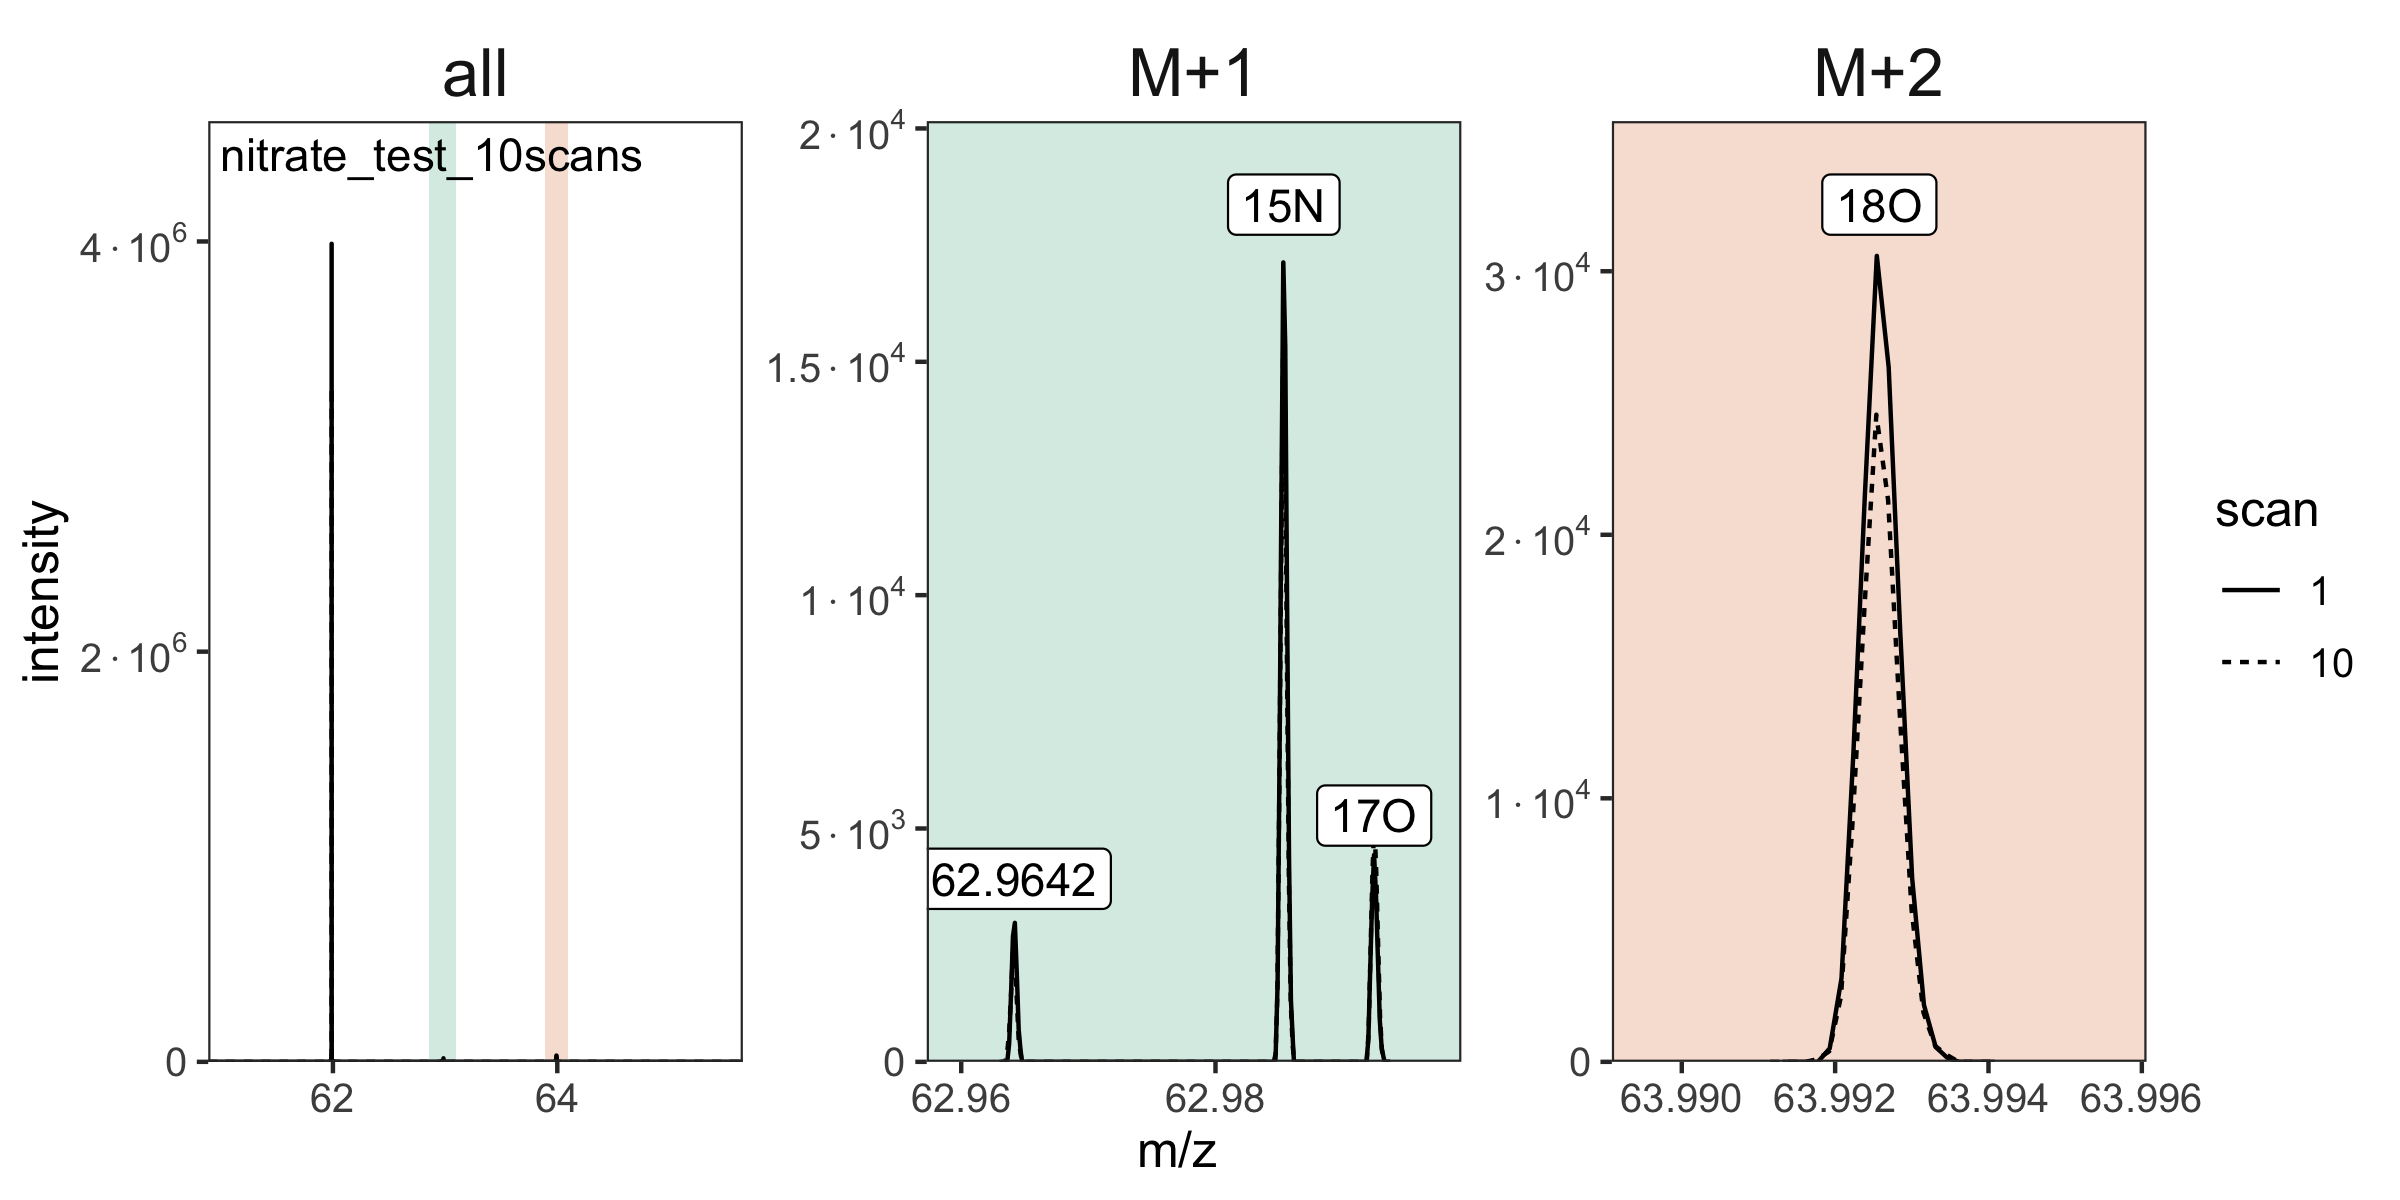
# process raw files data
dataset <- raw_files |>
  # filter out unidentified peaks
  orbi_filter_isotopocules() |>
  # check for satellite peaks
  orbi_flag_satellite_peaks() |>
  # define base peak
  orbi_define_basepeak(basepeak_def = "M0")

# plot the resulting isotopocule ratios
dataset |> orbi_plot_raw_data(y = ratio)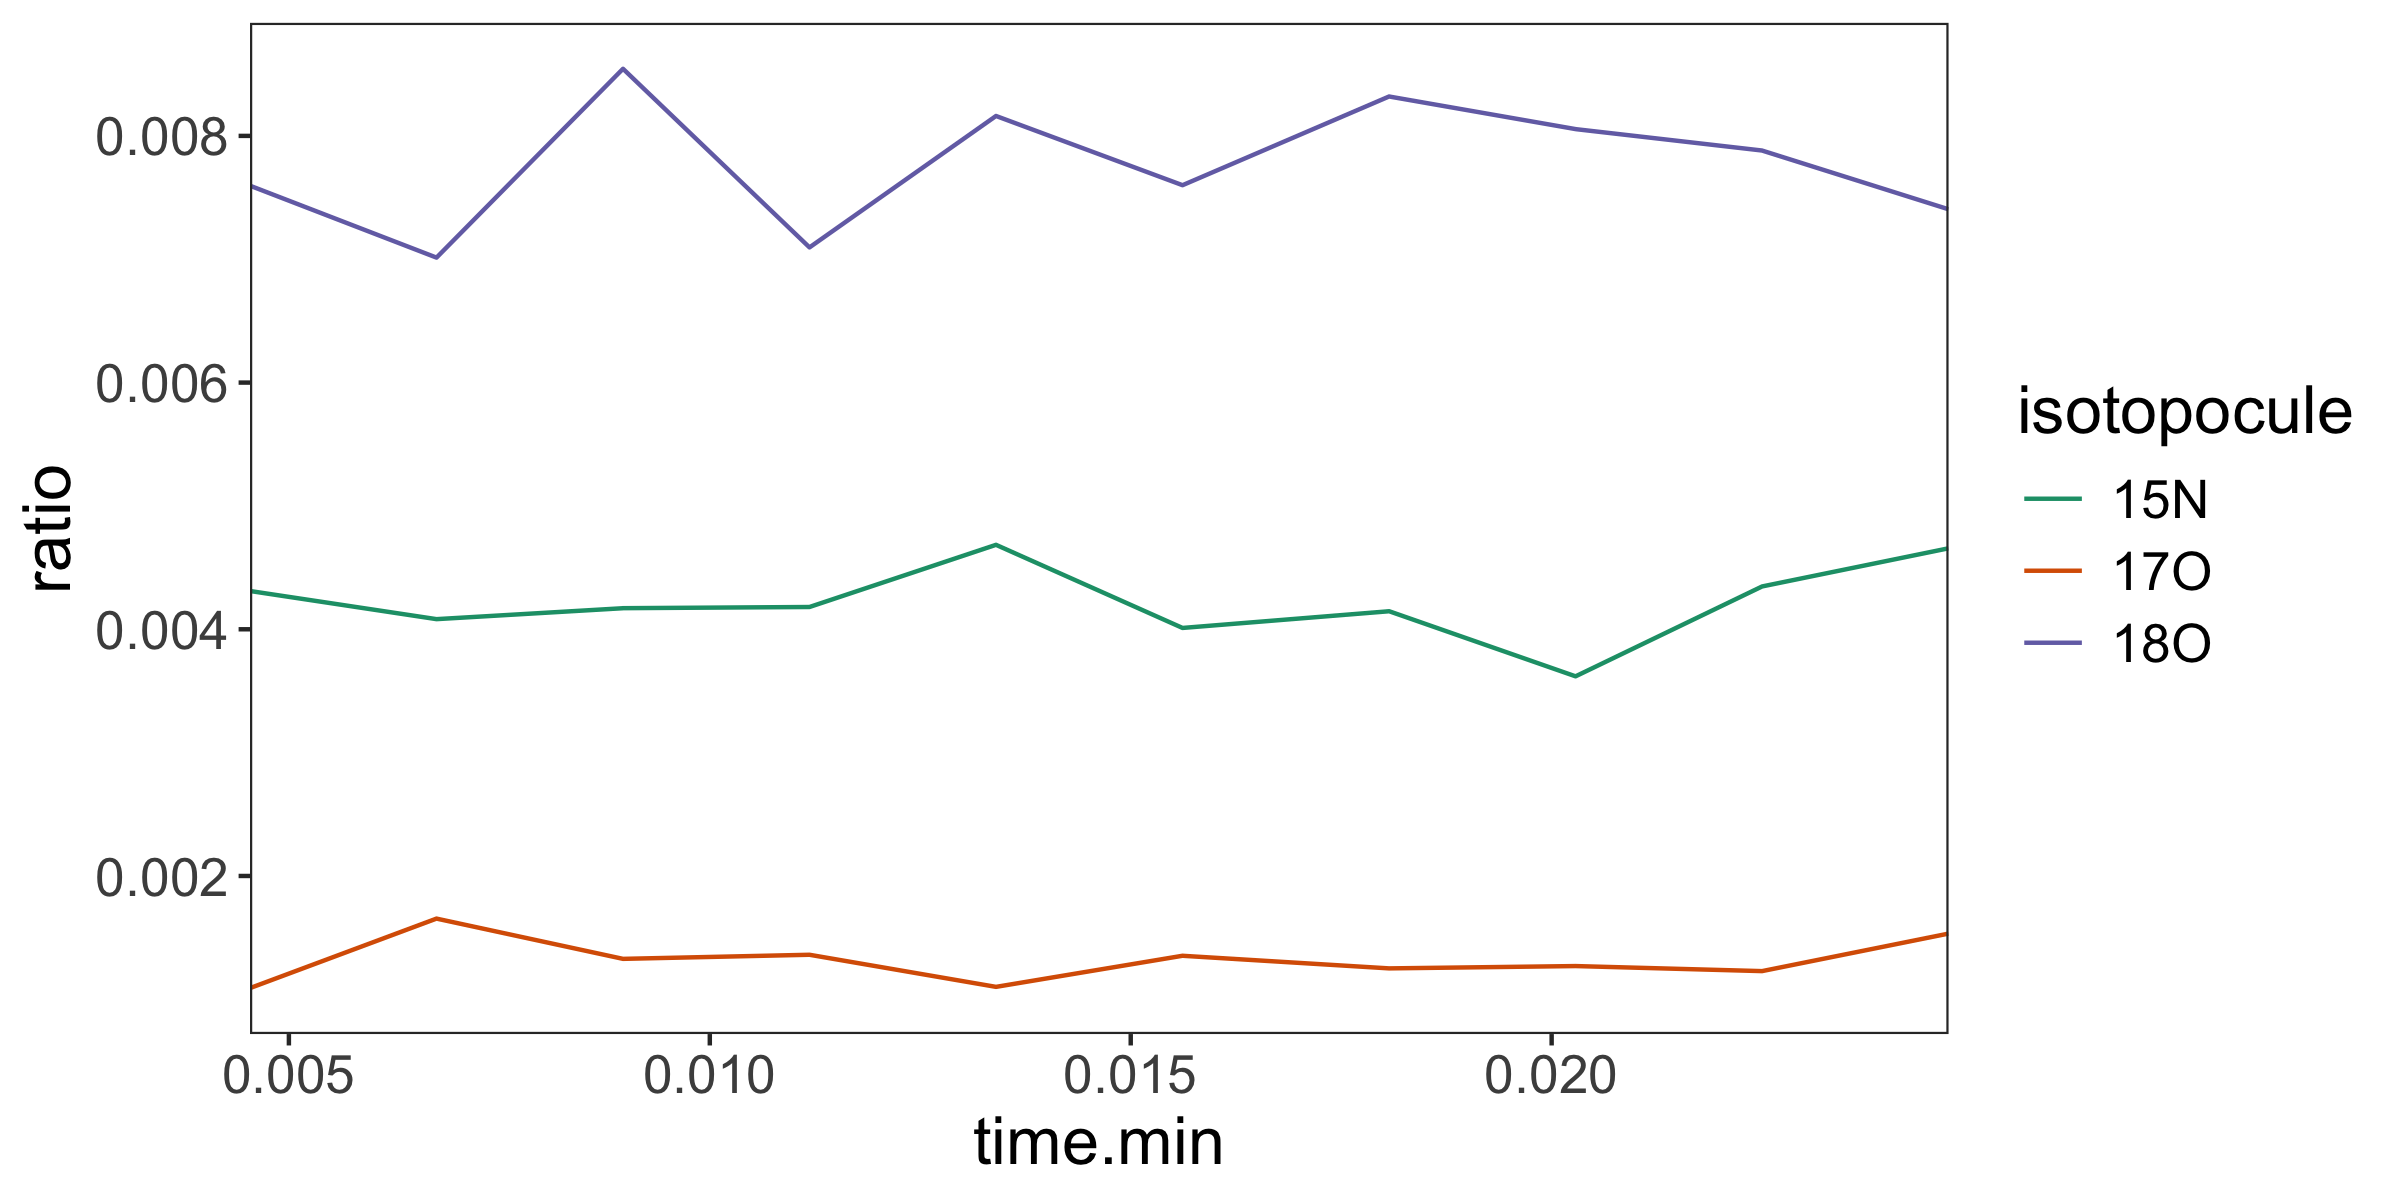
# calculate ratios across scans
results <- dataset |> orbi_summarize_results(ratio_method = "sum")

# print results
results |>  orbi_get_data(summary = c("isotopocule", "ratio", "ratio_sem"))

# export data & results to excel
results |> orbi_export_data_to_excel(file = "data_summary.xlsx")

# A tibble: 3 × 5
   uidx filename             isotopocule   ratio ratio_sem
  <int> <chr>                <fct>         <dbl>     <dbl>
1     1 nitrate_test_10scans 15N         0.00422 0.0000980
2     1 nitrate_test_10scans 17O         0.00132 0.0000554
3     1 nitrate_test_10scans 18O         0.00775 0.000162
For additional code, please check out our Examples in the main menu at isoorbi.isoverse.org, and peruse the full package structure below.

If you encounter a bug, please file an issue with a minimal reproducible example on GitHub.
For questions and other discussion, please use the isoorbi slack workspace.