![]()
![]()
![]()
The goal of paar is to provide useful tools for cleaning
and processing spatial data in precision agriculture.
You can install the released version of paar from CRAN with:
install.packages("paar")You can install the development version from GitHub with:
# install.packages("pak")
pak::pkg_install("PPaccioretti/paar")The package provides a complete protocol for automated error removal. Default values of all functions are optimized for precision agriculture data.
library(paar)
library(sf)
#> Warning: package 'sf' was built under R version 4.5.2
data("barley", package = 'paar')
The barley dataset contains grain yield data collected
were using calibrated commercial yield monitors, mounted on combines
equipped with DGPS.
#Convert barley data to an spatial object
barley_sf <- st_as_sf(barley, coords = c("X", "Y"), crs = 32720)
barley_dep <-
depurate(barley_sf, "Yield")
#> Concave hull algorithm is computed with
#> concavity = 2 and length_threshold = 0
# Summary of depurated data
summary(barley_dep)
#> normal point border spatial outlier MP spatial outlier LM
#> 5673 (77%) 964 (13%) 343 (4.6%) 309 (4.2%)
#> global min outlier
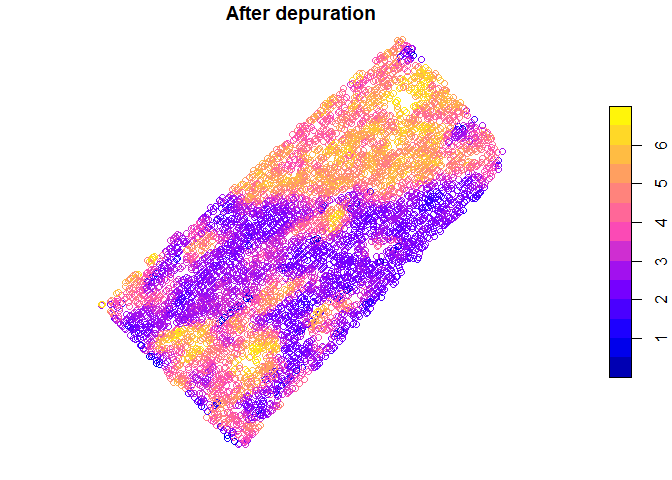
#> 99 (1.3%) 6 (0.081%)Spatial yield values before and after the depuration process can be visualized
plot(barley_sf["Yield"], main = "Before depuration")
plot(barley_dep$depurated_data["Yield"], main = "After depuration")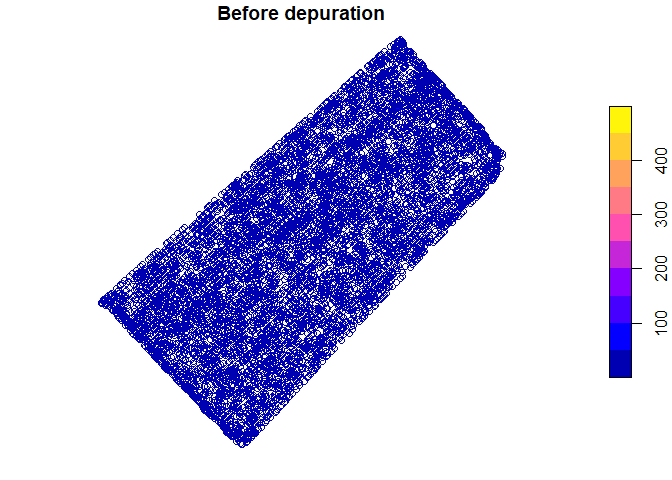
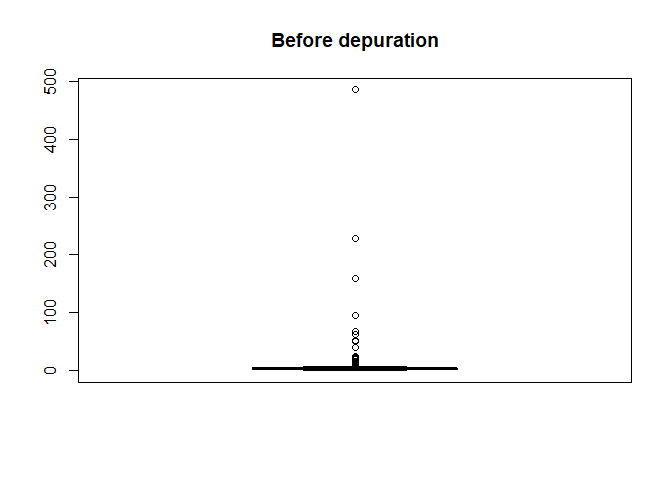
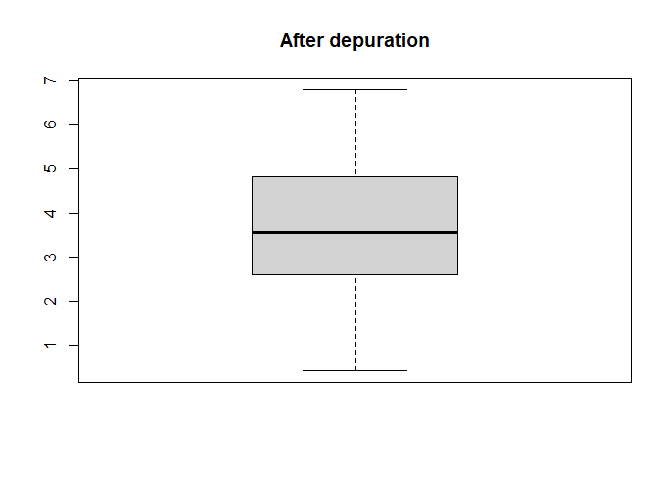
The distribution of yield values can also be compared
boxplot(barley_sf[["Yield"]], main = "Before depuration")
boxplot(barley_dep$depurated_data[["Yield"]], main = "After depuration")